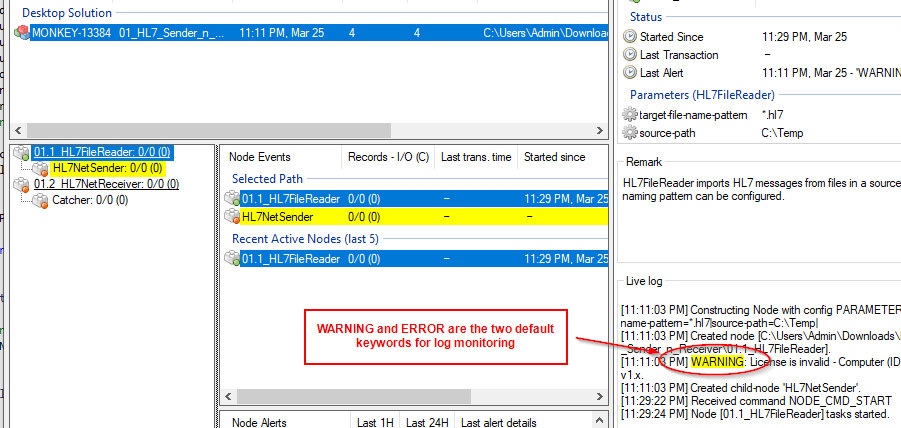
In Foldda Integrator’s live logging panel, it automatically highlights the keywords that are “of interest”. This feature is called Keyword Monitoring. It’s called “monitoring” not only because it brings these encountered keywords to your attention, but it will also send automatic emails to notify you of these keyword encounters if you have the SMTP set up in the runtime. Once it’s set up, it can become a powerful event-monitoring system that alerts the email recipients based on realtime logging activities.
By default, Foldda Integrator monitors two keywords – ‘ERROR’ and ‘WARNING’, as shown below –
You can define your own custom keywords or phrases in a node’s config file, using the CustomAlertPatterns tag. For example –

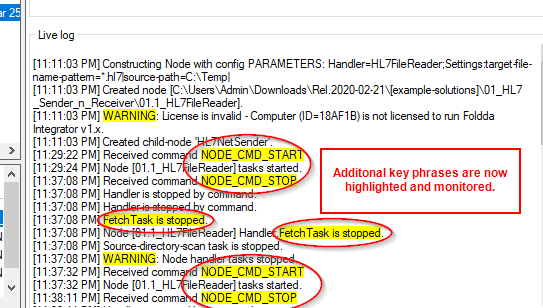
In this example above, we defined two additional key phrases that Foldda Integrator will monitor and highlight. Note the second phrase is defined in Regular Expression. “NODE_CMD_ST(ART|OP)” in Regular Expression means the pattern would match (be applicable to) both strings “NODE_CMD_START” and “NODE_CMD_STOP”.
Remember you’ll need to restart the node once you’ve changed its config settings. Below is the log-monitoring outcome when running the node with the changed settings –
You can download the above solution here and have a play by yourself.